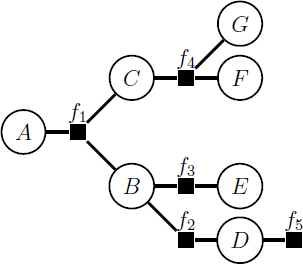
[2 P] Show how the given marginal probabilities can be computed in the factor graph in Fig. 2 using the sum-product algorithm. Start with drawing arrows to the factor graph which show how the messages are passed. After that write down how each of the messages can be computed and finally write down the formula for the marginal distribution.